Understanding JMeter Results
Jan 28, 2015
2 mins read
JMeter is the best and free Performance testing tool. This article is all about understanding JMeter results.
When I started working on JMeter for performance testing of Code Beautify, I got confused when got the result. All JMeter results terms are gibberish to me. So I have started searching Google to find and understand what this report wants to say. What I have learned would like to share with you.
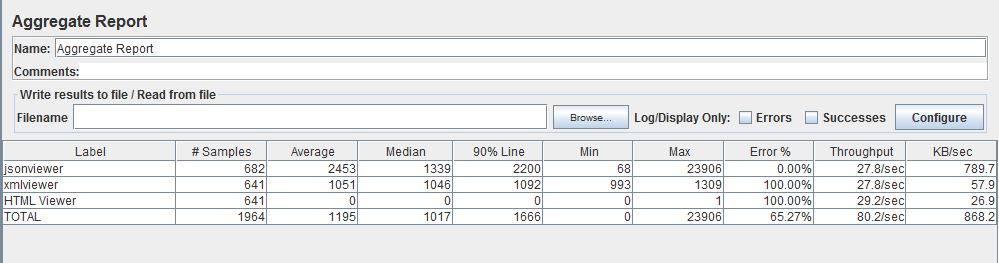
This is a snapshot of sample JMeter results.
 ][1]
][1]Understanding JMeter Results
Let’s decode this results:
This an aggregated Report of JMeter having these columns Label, # Samples, Average, Median, 90% Line, Max, Min, Error %, Throughput, KB/Sec.
-
Label: Label column display HTTP request created for the test. i.e for me the request is http://127.0.0.1/jsonviewer and give label as jsonviewer.
-
# Samples: Samples shows the number of HTTP request runs for the given thread. In this case, jsonviewer makes 682 requests.
-
Median: is a number which divides the samples into two equal halves. Half of the samples are smaller than the median, and half are larger.
-
90% Line: is the value below which 90% of the samples fall. The remaining samples too at least as long as the value. This is a standard statistical measure.
-
Max / Min: These are the minimum and maximum value of the time required for receiving the web page.
-
Error %: This column indicated the percentage of error. For HTML Viewer made 641 requests and failed each and every request, so it gave 100% error rate. If Server is not able to serve the request, this column will help to determine the capability of the server to serve the requests.
-
Throughput: is calculated as requests/unit of time. The time is calculated from the start of the first sample to the end of the last sample. This includes any intervals between samples, as it is supposed to represent the load on the server. Formula : Throughput = (number of requests) / (total time).
-
KB/ Sec: The throughput measured in Kilobytes per second.
I hope this may help to understand JMeter’s results.
category
- Blogging (1)
- HTML (1)
- Java (4)
- Javascript (5)
- Jquery (2)
- JSON (5)
- Mysql (1)
- Performance (1)
- Php (1)
- Problem solving (3)
- Python (9)
- Testing (1)
- Xml (2)
Recent Articles
- Create a JSON File : 3 Easy Ways
- Byte Array to String in Java
- Iterate Java List Using Loop, ForEach, Iterator and More
- HTML Space: 3 Easy Ways
- Java Get Hostname
- String to Char Array Java
- Check Undefined in Javascript: 2 Ways to Do It
- How to Print XML? Simple 2 Step Process
- JSON Example With Data Types Including JSON Array
Sharing is caring!